
A social network analysis of dreams
Table of Contents
Introduction
The interpretation of dreams is the royal road to a knowledge of the unconscious activities of the mind. –Sigmund Freud
One fun fact about me is that I always remember my dreams when I wake up. Since 2019, I have been keeping a dream journal, writing down the narratives that took place during my sleep before they escaped from memory. Though by no means comprehensive, this dream journal will offer some interesting insight into my unconscious and my real life.
Unlike the Freudian approach, I aim to understand my dreams in a quantitative way, using data analytic tools I learned through research over the past few years, including natural language processing, social network analysis, and data visualization.
Feel free to check the Github repository of this project for more information.
Data summary and workflow
The dream corpus used for this demonstration contains 100 dream entries entered between January and June 2019. Below is a glance at the file:

As you can see, each dream narrative contains names, locations, and emotional states. In this demonstration, I will first create a social network for the character names in my dreams. Then, I will use sentiment analysis to explore how my emotional states in dreams have flucuated across time.
Social network analysis of dreams
1. Preparation
We will pre-process the dreams using the nltk package. The codes below are adapted from this amazing tutorial.
# import packages
from tkinter import N
import nltk #for extracting names from documents
from nltk import ne_chunk, pos_tag, word_tokenize
from nltk.tree import Tree
import numpy as np
import math
import itertools
import networkx as nx #for social network analysis
import matplotlib.pyplot as plt #for plotting graph
import collections
import csv #for reading corpus

#reading dream corpus
with open(filename, 'r') as csvfile:
    # creating a csv reader object
    csvreader = csv.reader(csvfile)
    # extracting field names through first row
    fields = next(csvreader)
    # extracting each data row one by one
    for row in csvreader:
        dreams.append(row)
    # get total number of rows
    print("Total no. of rows: %d"%(csvreader.line_num))
2. Extracting names from dream corpus
Next, we extract all character names that appeared in the dream corpus and create an adjacency matrix for all possible combinations of names.
#extract names
#create empty list holding names
name_list = list()
dream_name_list_all = list()

# Extract
for dream in dreams:
    # parsing each dream document
    nltk_results = ne_chunk(pos_tag(word_tokenize(dream[0])))
    dream_name_list = []
    #for each dream in the corpus,
    #create list containing all names in that dream
    for nltk_result in nltk_results:
        if type(nltk_result) == Tree:
            name = ''
            for nltk_result_leaf in nltk_result.leaves():
                name += nltk_result_leaf[0] + ' '
            #print the content of each dream
            print ('Type: ', nltk_result.label(), 'Name: ', name)
            #add character names to the list of all names
            if nltk_result.label() == 'PERSON':
                if name not in dream_name_list:
                    dream_name_list.append(name)
                if name not in name_list:
                    name_list.append(name)
    #add list of names in each dream
    # to the list of names across all dreams
    dream_name_list_all.append(dream_name_list)

#create matrix for all name pairs
graph = np.zeros((len(name_list), len(name_list)))
Now, we should have an adjacency matrix called graph containing all possible combinations of names. The matrix consists of all 0s
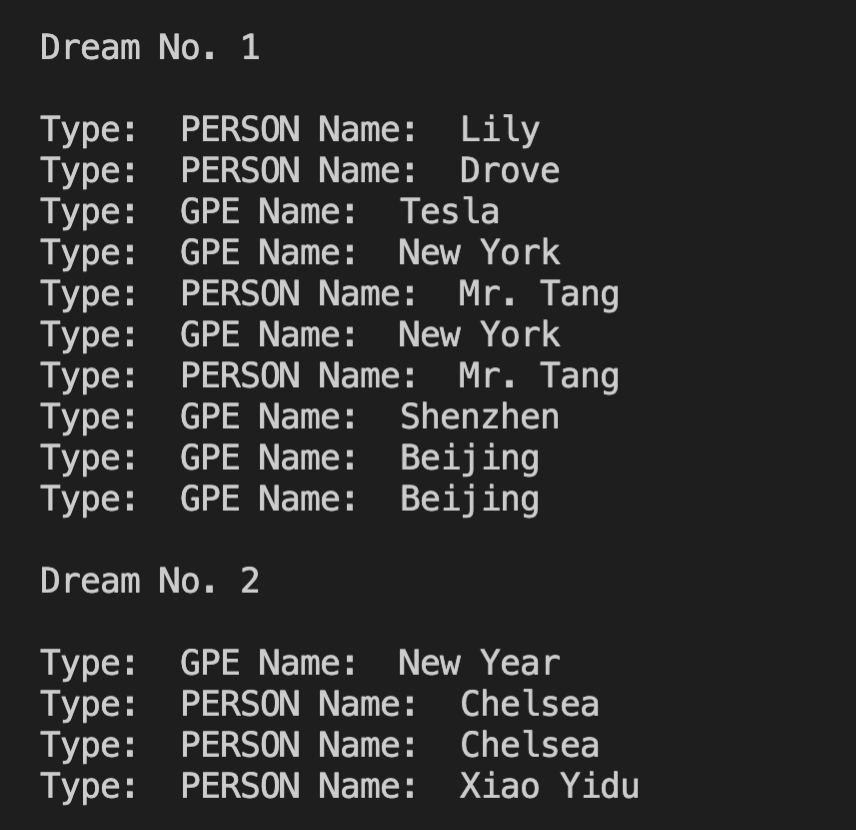
Note that we can also examine the extracted names of nltk using .label(). nltk can distinguish between person names (“PERSON”) and geo-political entities (“GPE”) like city names. Below are the extractions from two dreams:
3. Creating social network ties
We will now update the values in the adjacency matrix by going through each dream document in the corpus to determine how many times each pair of names have co-occurred. Two people that appeared in the same dream are considered “connected” in the dream social network. The more two people have co-occurred, the higher their corresponding value in the matrix.
#for each dream's name list, code each pair
for dream_name_list in dream_name_list_all:
    for name_pair in itertools.combinations(dream_name_list, 2):
        graph[name_list.index(name_pair[0])][name_list.index(name_pair[1])] += 1
4. Plot social network graph
We can use the networkX and matplotlib packages to plot dream social network by converting the adjacency matrix into a graph.
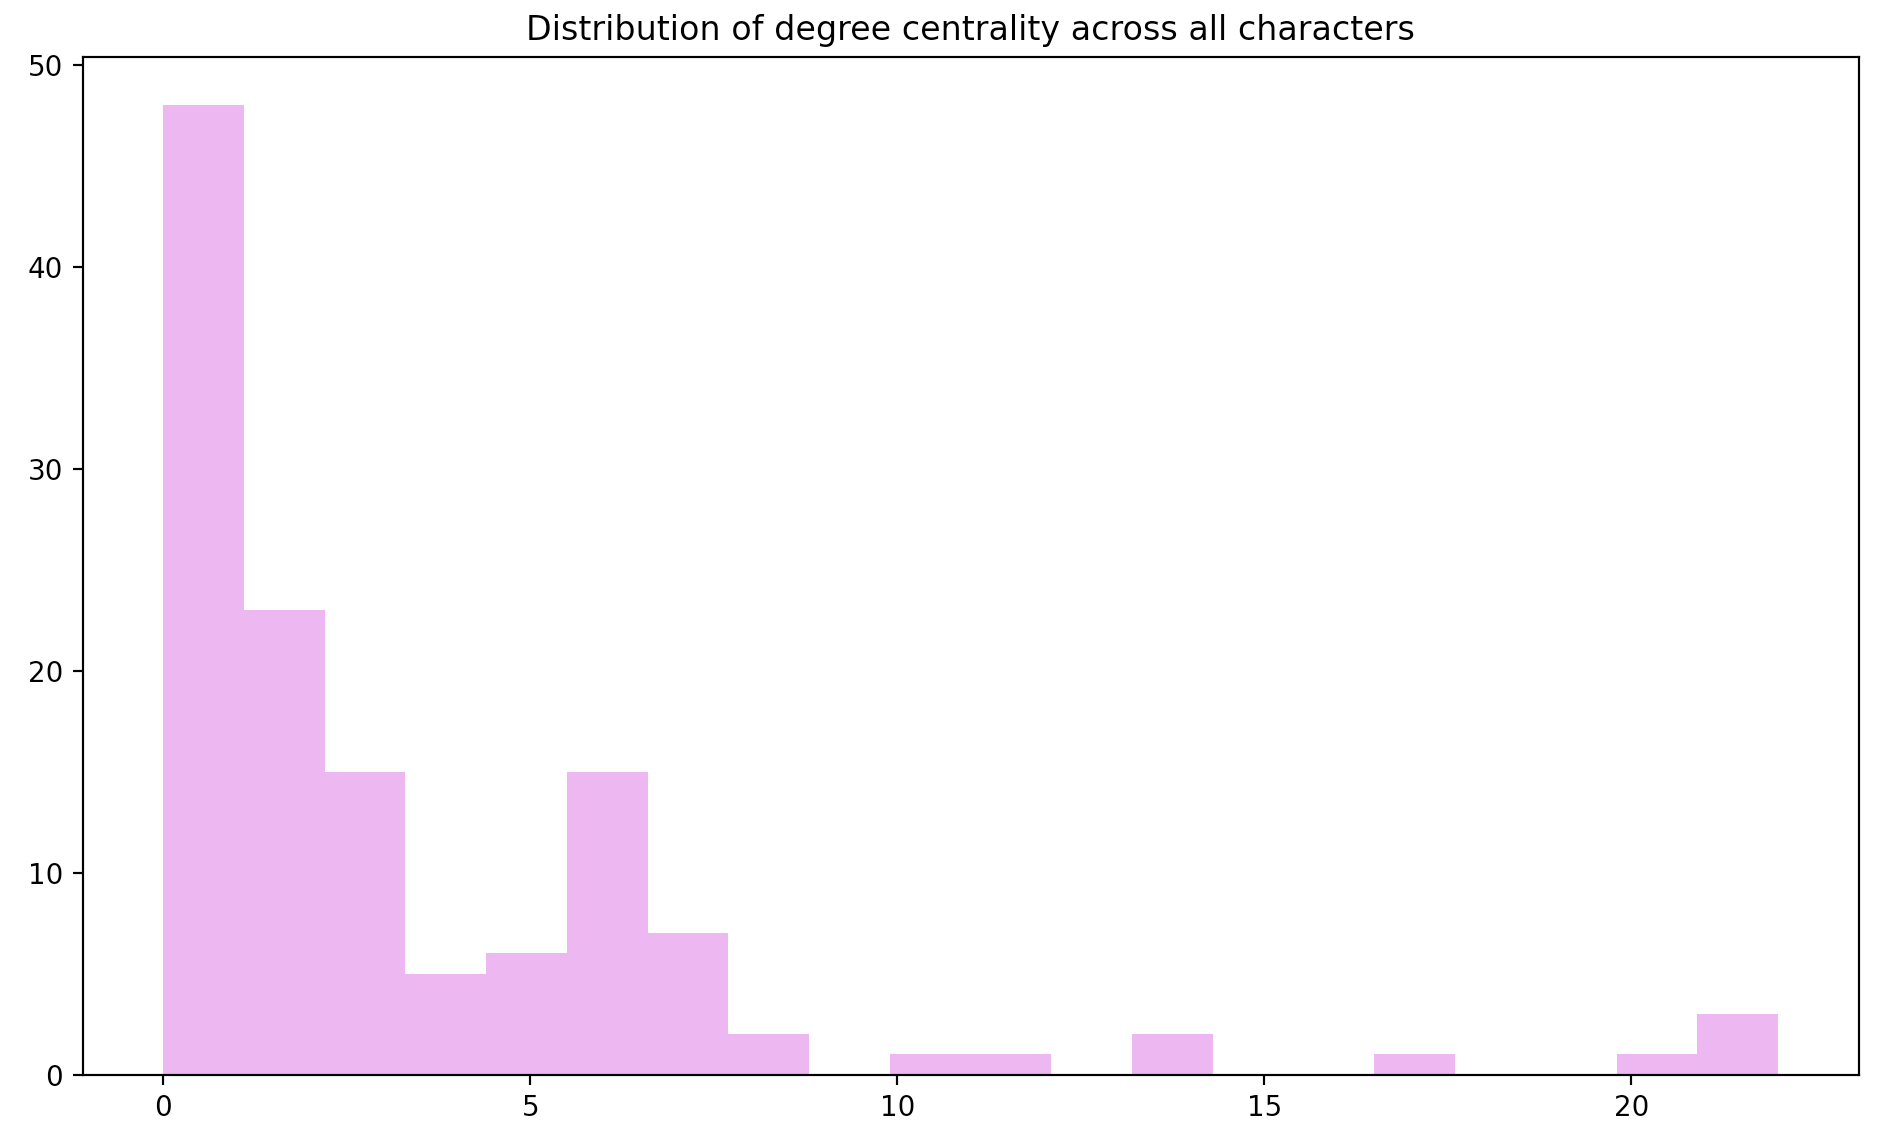
First, let’s visualize how many times each character has occured across all dreams, that is, the distribution of the degree centrality of each node. As the first figure shows, degree centrality appears to follow a power-law distribution, as in many real-life social networks.
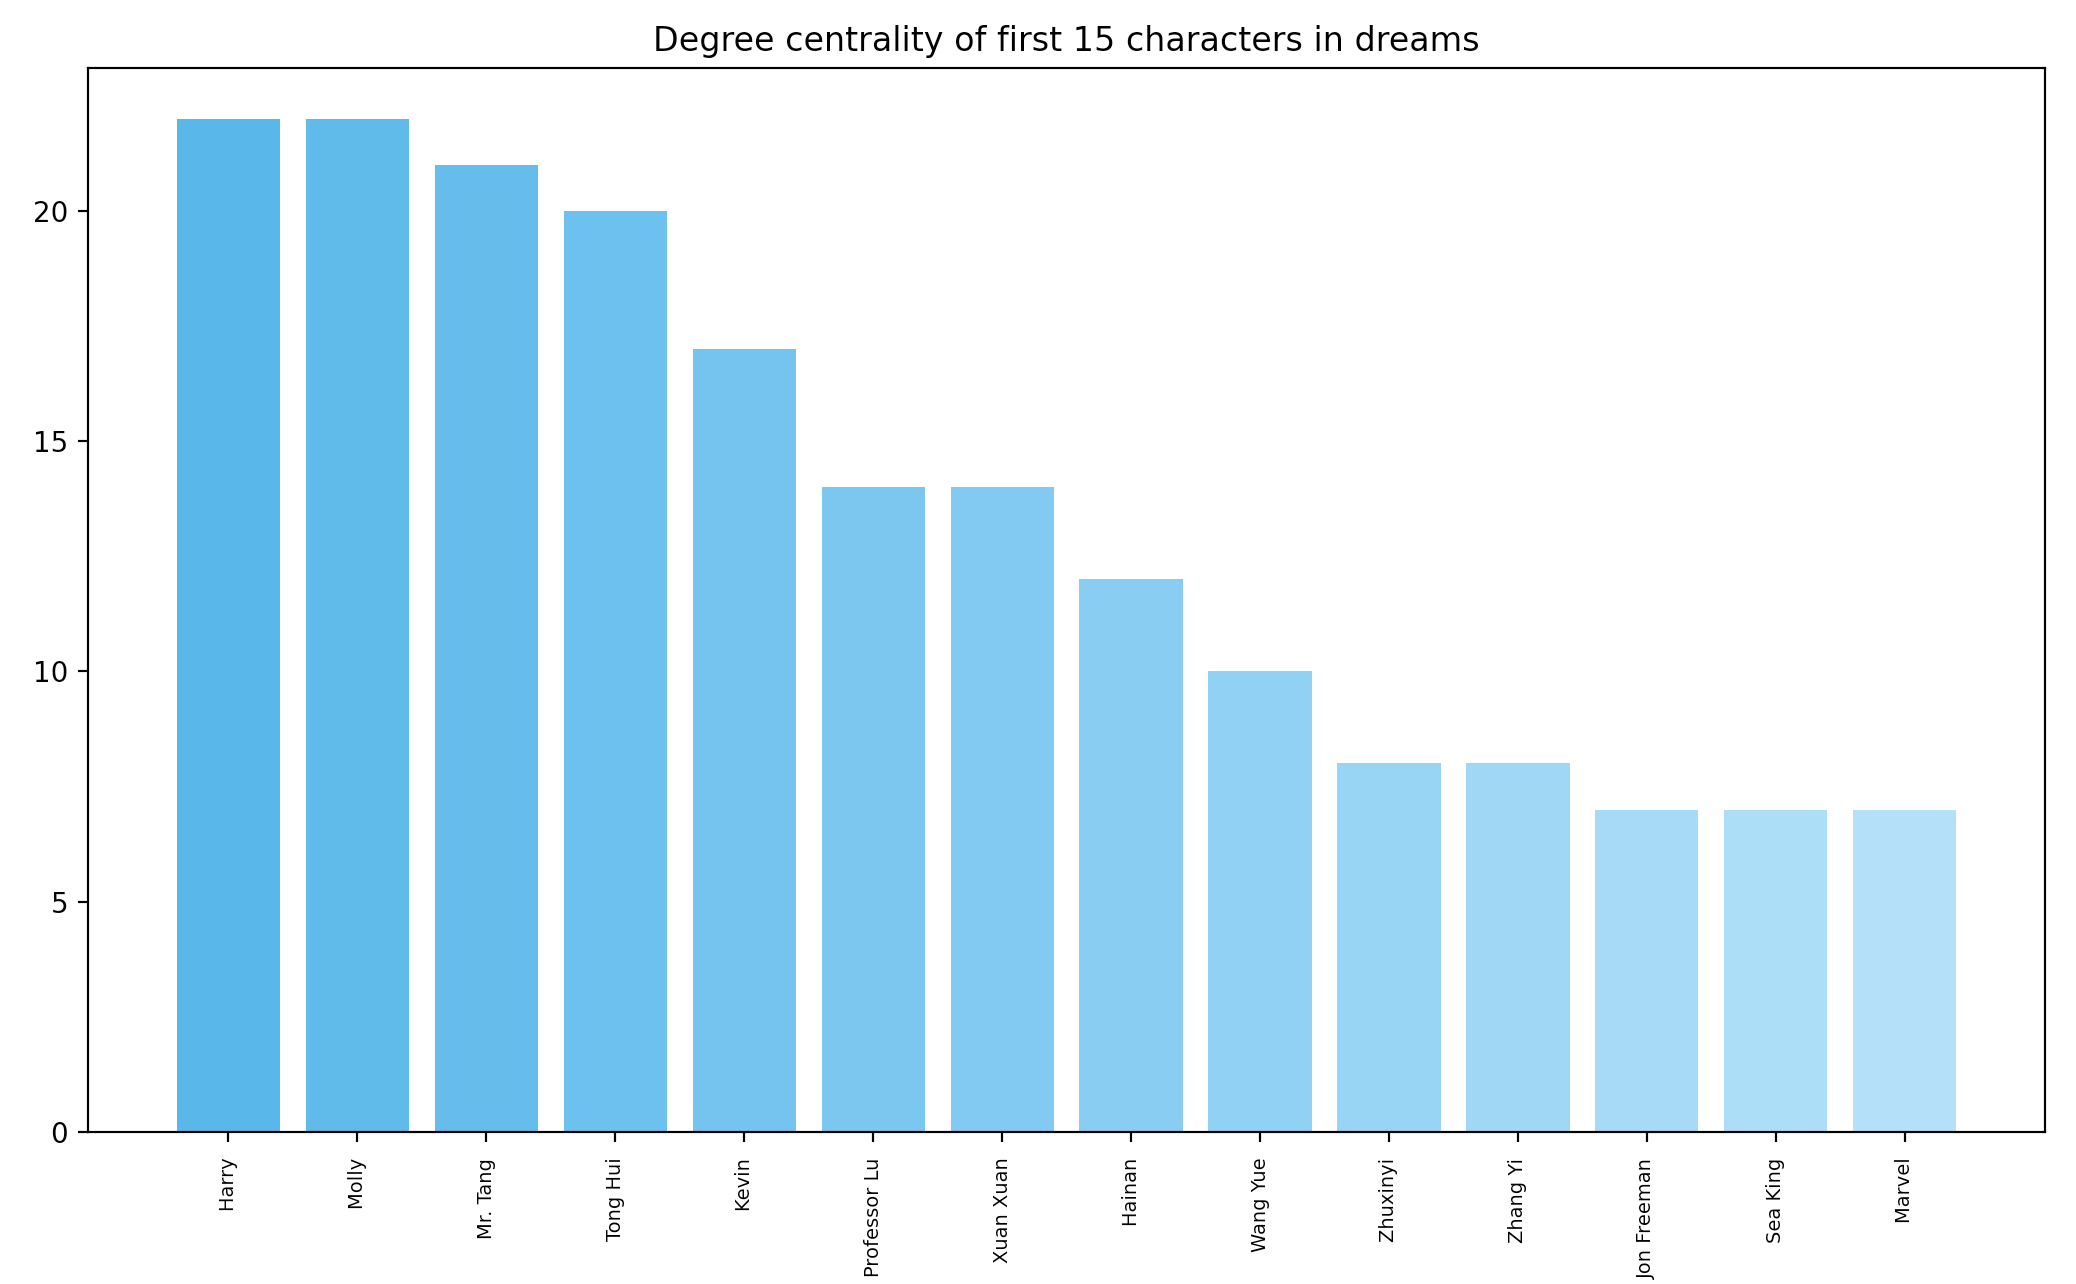
The second figure shows the degree centrality of the 15 most “popular” characters. Take a guess at who they are–yes, they are among my closest friends and people I know from work.
#create and plot graph using neworkX
nxgraph = nx.from_numpy_matrix(graph)

#rename nodes with character names
mapping = dict(zip(nxgraph, name_list))
nxgraph = nx.relabel_nodes(nxgraph, mapping)
d = dict(nxgraph.degree)

#plot the distribution of degrees for first 15 names
#sort dictionary
d_sorted = sorted(d.items(), key=lambda kv: kv[1], reverse = True)
d_sorted = collections.OrderedDict(d_sorted)
keys = d_sorted.keys()
values = d_sorted.values()
plt.bar(list(keys)[0:14], list(values)[0:14], color = get_color_gradient(color1, color2, 15))
plt.xticks(rotation = "vertical", size = 7)
plt.title("Degree centrality of first 15 characters in dreams")
plt.show()

#plot histogram for degree distribution
plt.hist(list(values), color="#F3A0F2",  bins=20)
plt.title("Distribution of degree centrality across all characters")
plt.show()
Next, let’s visualize the network graph. Here, I set the size of each node to scale with degree centrality. The node names are not shown here for privacy.
#show network plot
#set node size by degree centrality
pos = nx.spring_layout(nxgraph, scale=20, k=3/np.sqrt(nxgraph.order()))
nx.draw(nxgraph, pos, with_labels=False,
    node_size=[math.sqrt(v+1) * 80 for v in d.values()],
    node_color = "#6dc9c0",
    edge_color = "#c5c7c5")
#set node color by centrality
plt.show()
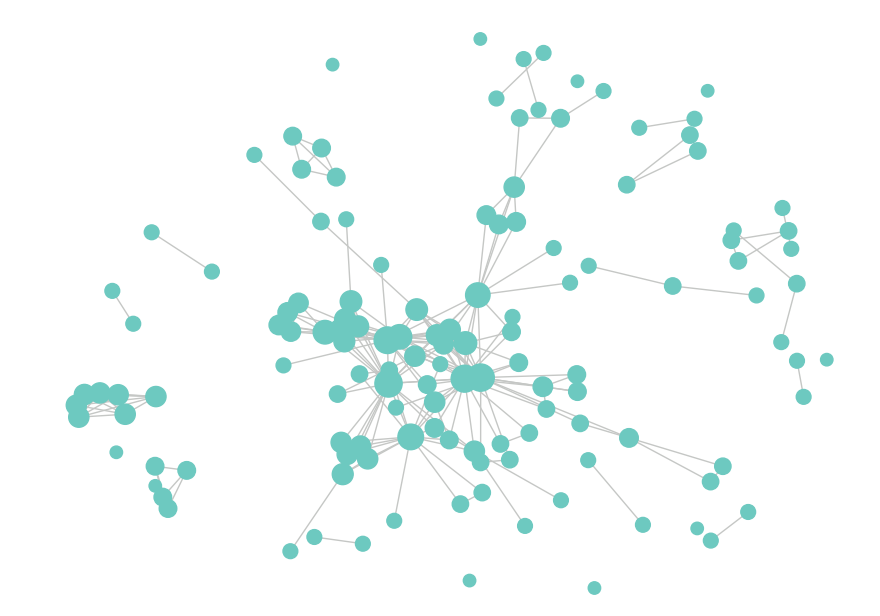
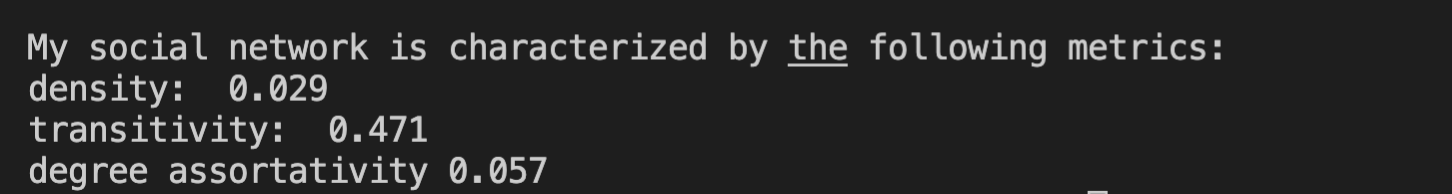
It is clear that the graph has one large component and several smaller ones and is similar to real-life social networks. To more quantitatively examine the nature of the network, we can use the networkX package to calculate network metrics, including density, transitivity, and assortativity.
#calculate and print network metrics:
density = nx.density(nxgraph)
transitivity = nx.transitivity(nxgraph)
assortativity = nx.degree_assortativity_coefficient(nxgraph)
print('\nMy social network is characterized by the following metrics:')
print('density: ', "{:.3f}".format(density))
print('transitivity: ', "{:.3f}".format(transitivity))
print('degree assortativity', "{:.3f}".format(assortativity))
Resources
Below are some resources I found useful while exploring my dream data:
Dreambank
Dreambank is a database for over 20,000 dream reports. Researchers have used it to answer many interesting questions about dreams, cognition, and consciousness, such as shifts in dream content across age and the structures of dream vs. real-life social networks (Han et al., 2016).
Natural language processing
Using the nltk package to extract information from natural languages. Link
Sentiment analysis in python. Link
DeepL is a useful translator I used to translate my dreams from Chinese to English. Link