
Mood Map | UX Research & Design
Role: UX Researcher, Front-End Developer
Duration: July – August 2025
Tools: React, Tailwind CSS, Supabase
Partner Organization: Flourish Science
Table of Contents
- Introduction
- Research
- Design iteration
- Prototype demo
- Real-world deployment
- Outcomes & reflection
- Credits
Introduction
Why: Being able to label one’s emotions is a skill essential for well-being, yet most emotion trackers limit users to fixed emotion labels (happy, sad) and focus on solitary reflection. Mood Map reimagines emotional awareness as a shared, interactive experience—helping people visualize and exchange emotions within teams and groups.
What: Mood Map is a browser-based prototype built on the Circumplex Model of Affect. It enables users to log emotions on a two-dimensional space (valence-arousal) using predefined or custom labels. All users’ moods are visualized simulteneously.
How: Digitized Flourish Science’s physical mood map into a React-based web tool with Supabase backend. Two rounds of usability testing (≈5 users each) led to refinements such as labeled mood blocks, clearer visuals, and the ability to share mood board with teammates, which increased user experience and engagement.
User Research
To gather users’ feedback on the initial version of the Mood Map and improve the ease of interaction with the emotion-mapping interface, I ran two rounds of informal usability testing (5 users each), and iterated through two designs.
Key Insights:
- Users found the valence–arousal axes confusing without clear anchors (the entered labels often don’t align with the valence & arousal values).
- Predefined emotion labels improved orientation while maintaining flexibility.
- The ability to customize and share mood boards sets the product apart from the existing physical mood map.
Design Iteration
Mood Map Version 1
Mood Map Version 2
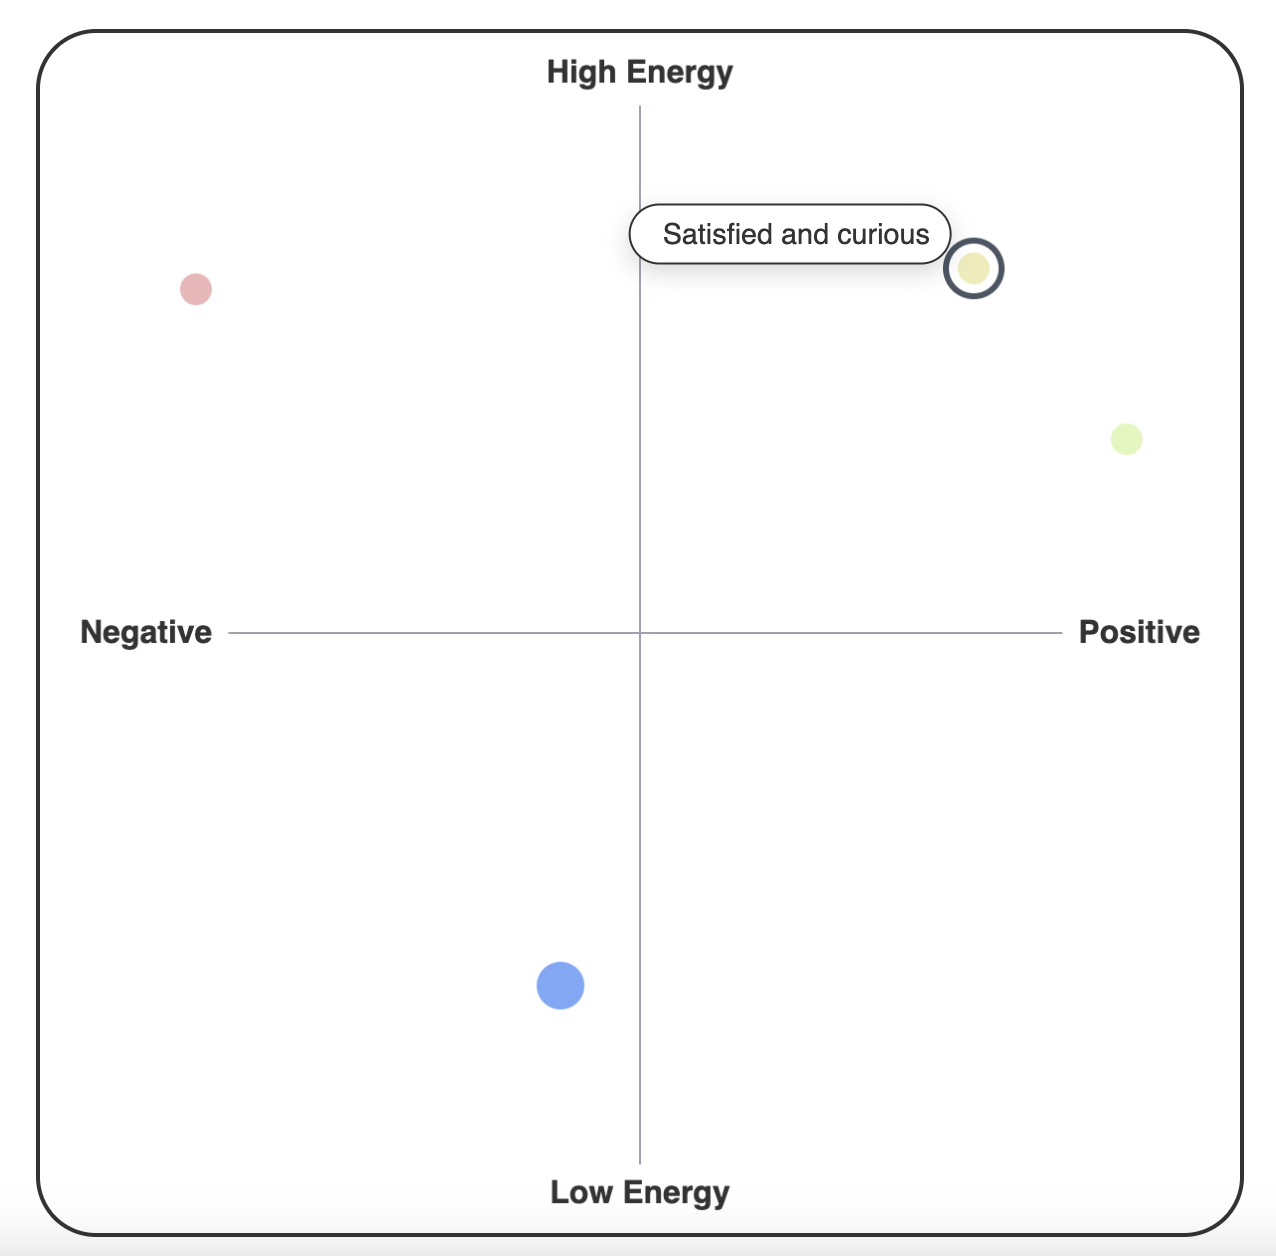
V1 — Open-Ended Exploration
The first prototype let users double-click anywhere on the grid to label their mood freely.
While this design is highly flexibility, many users found it unclear how to interpret the valence and arousal axes or where to place emotions accurately.
As a result, some entries didn’t match the intended emotional dimensions—for instance, “sad” was sometimes labeled as a positive-valence emotion.
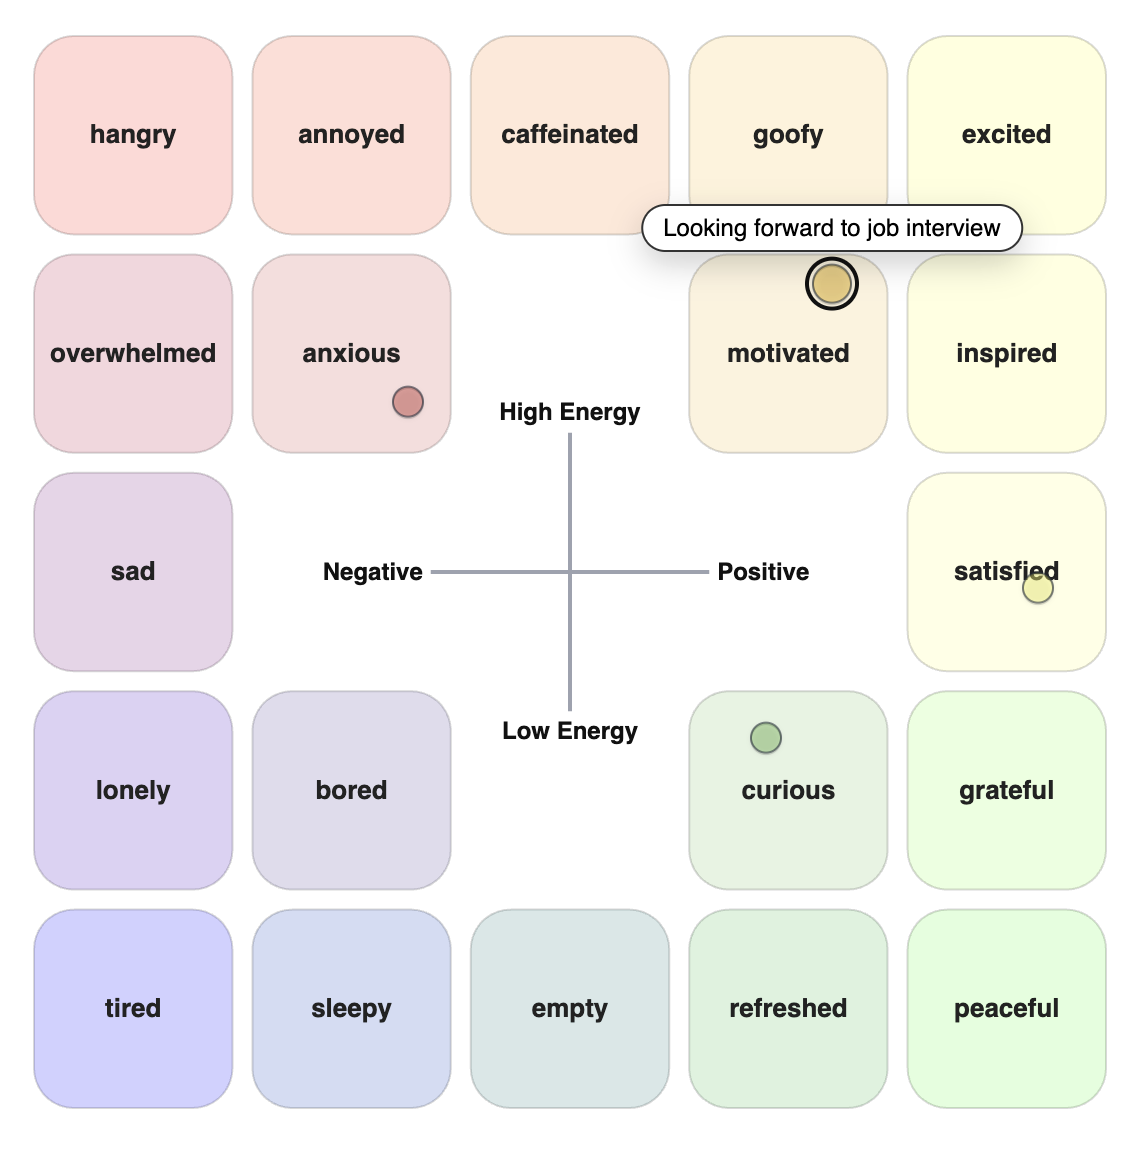
V2 — Guided but Flexible
To improve clarity, I added labeled axes and optional predefined emotion examples that help orient users while still allowing personalization.
Users can now either choose a predefined emotion or enter their own label.
V2 also introduced the ability to create and share mood boards with teammates, extending the tool’s use to collaborative or group settings.
Finally, I enhanced visual contrast, hover feedback, and layout responsiveness across devices, making the interaction smoother and more consistent overall.
Prototype Demo
Explore the digital Mood Map prototype here: Open interactive prototype.
Real-world deployment
To evaluate Mood Map in a real group setting, I deployed the prototype in two psychology lab sections and collected open-ended feedback from 42 students about their experience seeing classmates’ moods in real time.
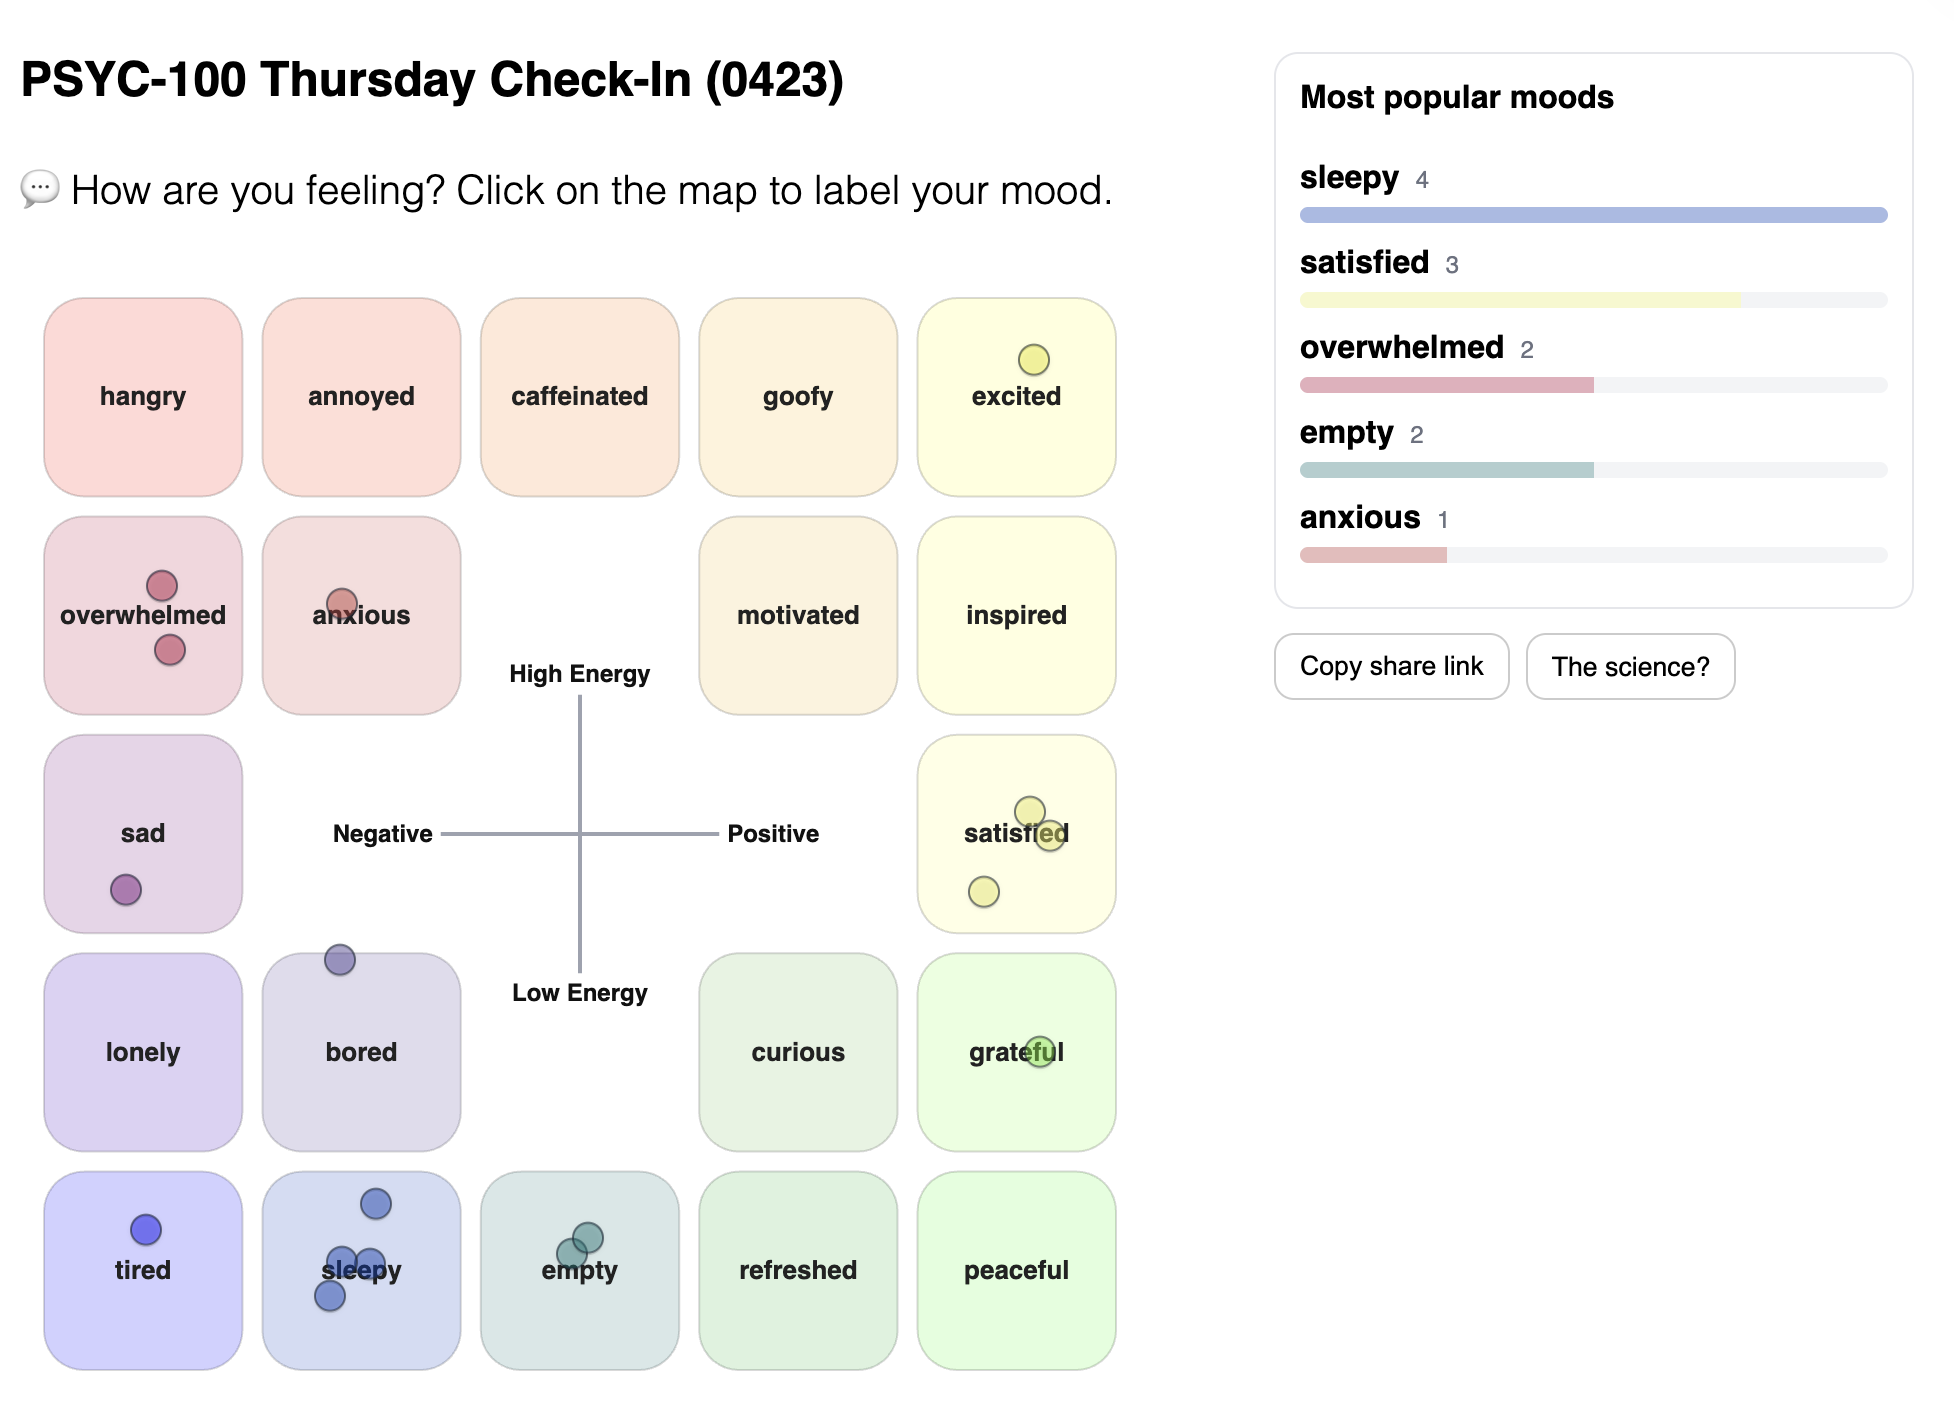
Real-time mood distribution from a classroom deployment.
Key Takeaways:
Quick and visual
Students described Mood Map as faster, easier to interpret, and more approachable than a longer affect survey.
Socially validating
The shared view helped many students feel reassured, connected, and less alone in their emotions.
Real-time awareness
Students valued seeing how group mood shifted during class and how their own mood compared with others'.
Less standardized
Compared with PANAS-style measures, students saw the map as more subjective and harder to analyze statistically.
Privacy and comparison
Some students noted that public mood visibility could make people self-conscious or influence their responses.
Limited explanation
The map shows where people are emotionally, but does not fully explain why they feel that way.
View representative student feedback
Validation
“Seeing my classmates record the same emotions in real time made me realize I'm not alone.”
Connection
“It feels nice knowing that I share a lot of moods with people in the class.”
Ease of use
“A mood map is quicker and more intuitive than the PANAS.”
Measurement tradeoff
“Mood maps are quick and intuitive for capturing real-time, mixed emotions but lack precision and standardization.”
Privacy and comparison
“It can also make people more self-conscious about their own mood.”
Outcomes & Reflection
- The digital prototype has been adopted into Flourish Science’s internal product ecosystem and is being prepared for public integration.
- A classroom deployment with 42 psychology students showed that Mood Map’s key strengths are its real-time, visual, and socially connective experience. Students found it quick and intuitive, and many said the shared view helped them feel validated or less alone in their emotions.
- Student feedback also clarified Mood Map’s tradeoffs: compared with validated surveys like PANAS, it may be less precise, less standardized, and more vulnerable to privacy concerns or social comparison. This positions Mood Map as a lightweight tool for group check-ins and emotional awareness, rather than a replacement for formal psychological measurement.
- Future iterations could consider refining onboarding instructions and adding features including privacy controls to enhance anonymity, and support for logging mixed-emotional states.
Credits
This project was inspired by the physical mood board developed by Julie and Xuan at Flourish Science. Their early design concept and team discussions provided the foundation for the digital adaptation.
Built with: React, Tailwind CSS, Supabase
View the full source code on GitHub.